RESEARCH·STRATEGY·SERVICE DESIGN

Hei Sitra, I'm Iida!

Selected work

Consulting Projects

Noren 2023 · International luxury vehicle company

Gamified Strategy

A luxury car company had renewed its UX strategy, but it lived in a document. How do you turn it into the way employees actually serve the client in front of them?
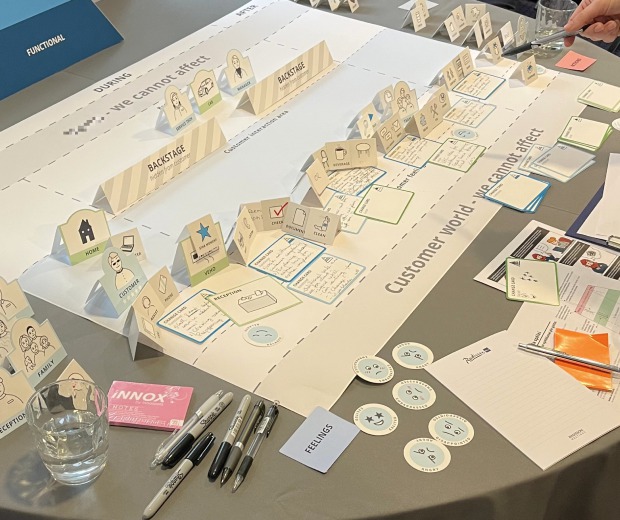
MethodsA series of co-design workshops across Finland and the Baltics, built on Business Origami: employees model their own client interactions with physical pieces on a board.
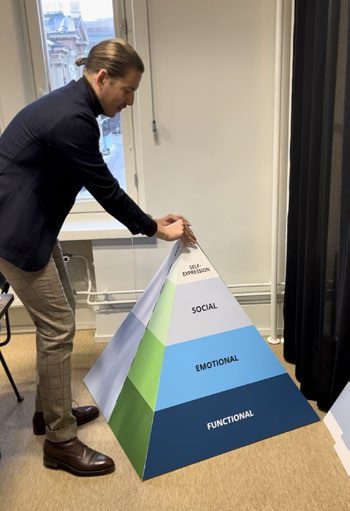
Key findingStrategy travels further as an object than as a document. The boards, a one-metre pyramid and user-story comics built shared understanding across disciplines, cultures and languages.
What changedParticipants gave great feedback on the facilitation and the preparation, and the client kept the relationship with the consultancy going after the series.
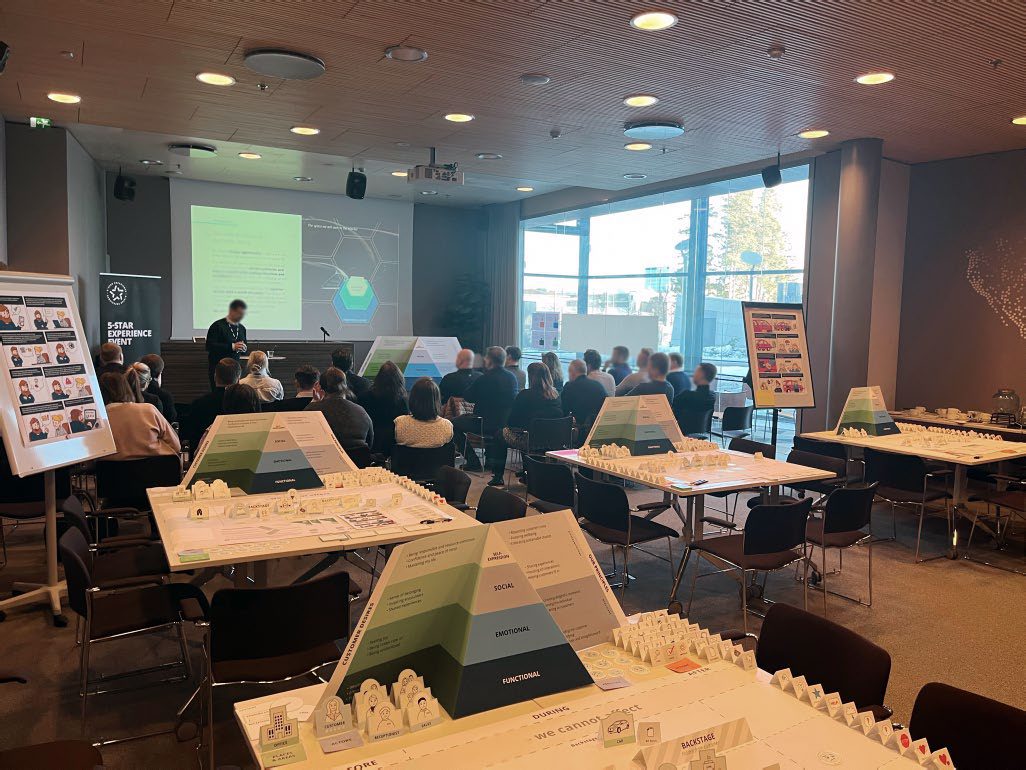
Workshop room with participants seated, a presenter and a projected slide A Business Origami board mid-session on a workshop table: folded paper pieces standing along printed lanes labelled backstage, customer interaction area and customer world we cannot affect, with hand-drawn cards, marker pens and a set of printed feeling tokens
A session in progress, and a board mid-session. Lanes for backstage, the customer interaction, and the customer's world the company cannot affect.
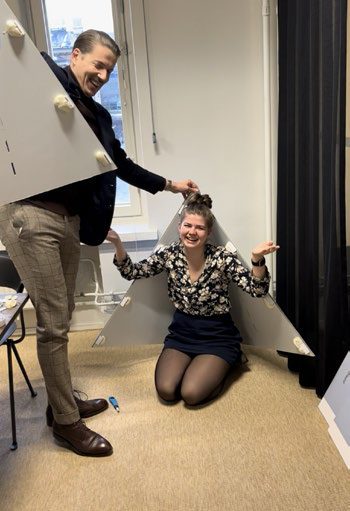
Unpacking the one-metre workshop prop pyramid The finished one-metre prop pyramid with a person standing beside it
Behind the scenes, the CEO and I found out the prop pyramid was big enough to hide in.

The storyEmployees visualised their client work through Business Origami, a service design technique that makes fuzzy business systems concrete. I designed the origami boards and props, co-created the visual identity and user story comics with a graphic designer, and facilitated workshops in Finland and the Baltics, in some as our consultancy's only person in the room. The sessions were deliberately mixed-language.
Noren 2022 · Finnish design bicycle brand

Not the Customer the Brand Imagined

Who really rides a design bicycle, what does cycling mean in their lives, and what should the brand do about it?
Methods15 ethnographic interviews across Finland and the Netherlands, a co-led semiotic benchmark of 15 brands, synthesis workshops with the client.
Key findingThe people actually buying the bicycles, and their reasons, did not match the company's picture of its customer.
What changedThe client rewrote its strategy and communication around the findings.
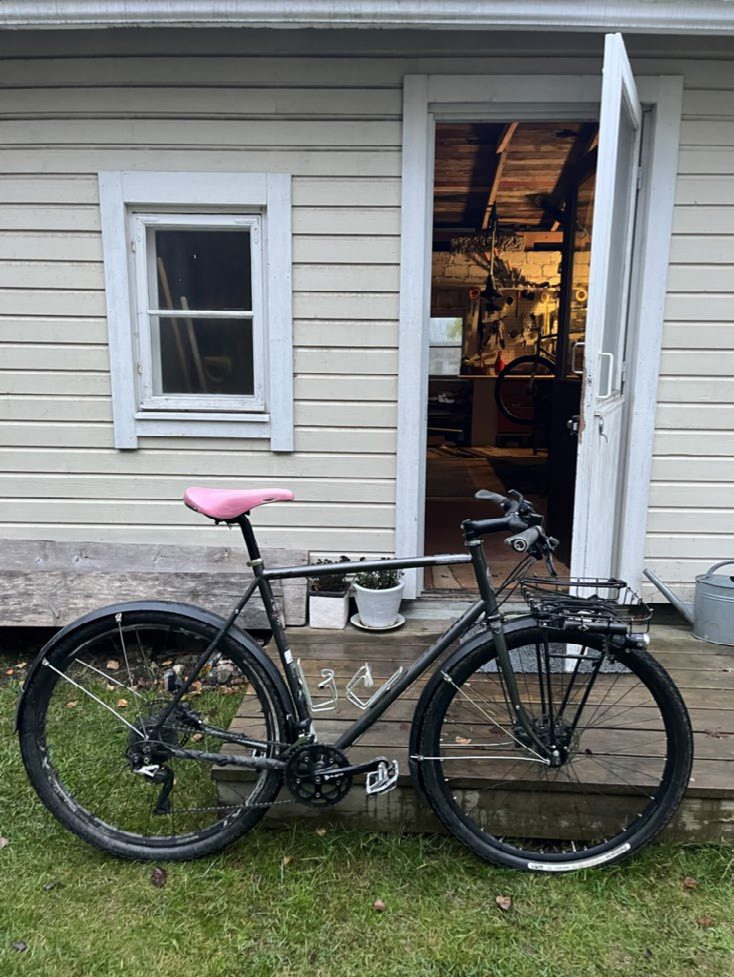
City bikes photographed during participatory observation
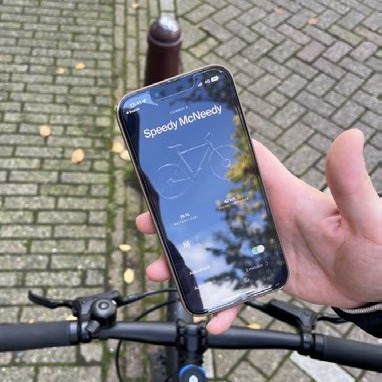
A phone held above bicycle handlebars on a wet brick street, its screen showing an app with a bicycle illustration and the name Speedy McNeedy

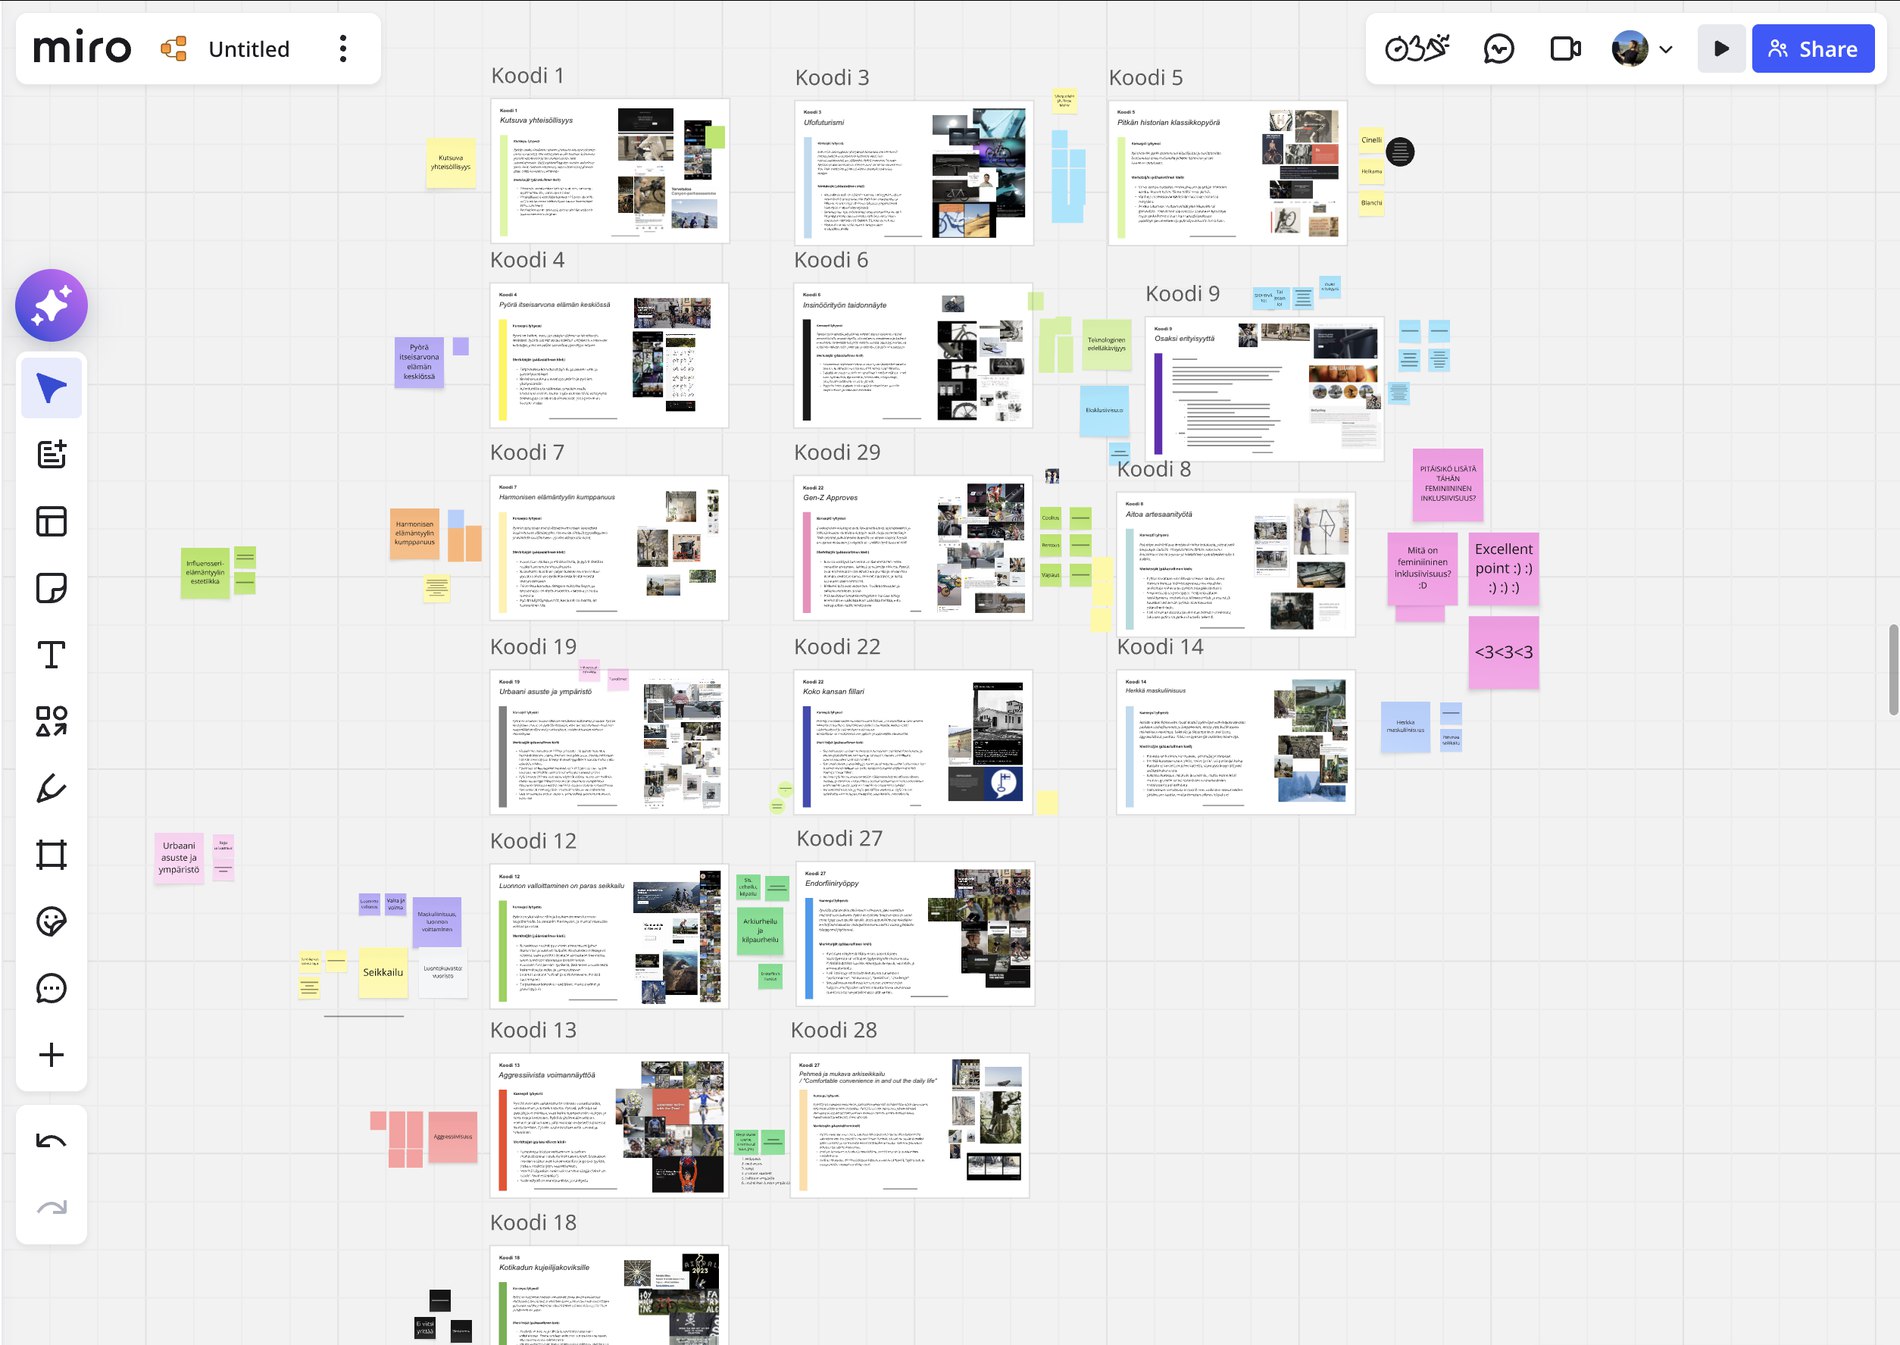
The storyAt the boutique strategy consultancy Noren I led the project with one colleague, owning facilitation and client relations, and conducted eight of the fifteen interviews myself. Alongside them we ran a semiotic benchmark of fifteen brands, coding what each one's imagery promised, so the interviews could be read against what the category was already saying. In the synthesis workshops, founders and store employees listened to anonymised excerpts rather than my summary of them. Hearing the messy reality in a customer's own words helped the founders and staff take ownership of the findings.

A Miro board holding the semiotic benchmark: eighteen numbered code frames, each naming a code and holding its visual evidence, surrounded by colour-coded sticky clusters and a colleague's comments
The semiotic benchmark a colleague and I built and argued over. Codes are in Finnish.

Freelance 2025–26 · Kanslo (pre-seed startup)

Building a Research Practice from Zero

A startup building an app to help people cut their smartphone use had no researcher. How do you set up research so the team asks the right questions and can find the answers later?
MethodsResearch ops built from scratch, then a first full cycle: a literature review, six sessions with seven participants in two languages, surveys on validated scales.
Key findingEvidence only moves a product if it is findable and ranked. A page per session, every hypothesis tied to the evidence behind it and the flow step it touches, and the founders reading their users first-hand.
What changedHypotheses now sit beside the backlog, each with a plan to test it, and the first standing principle came out of the cycle: if it shames the user, it doesn't ship.
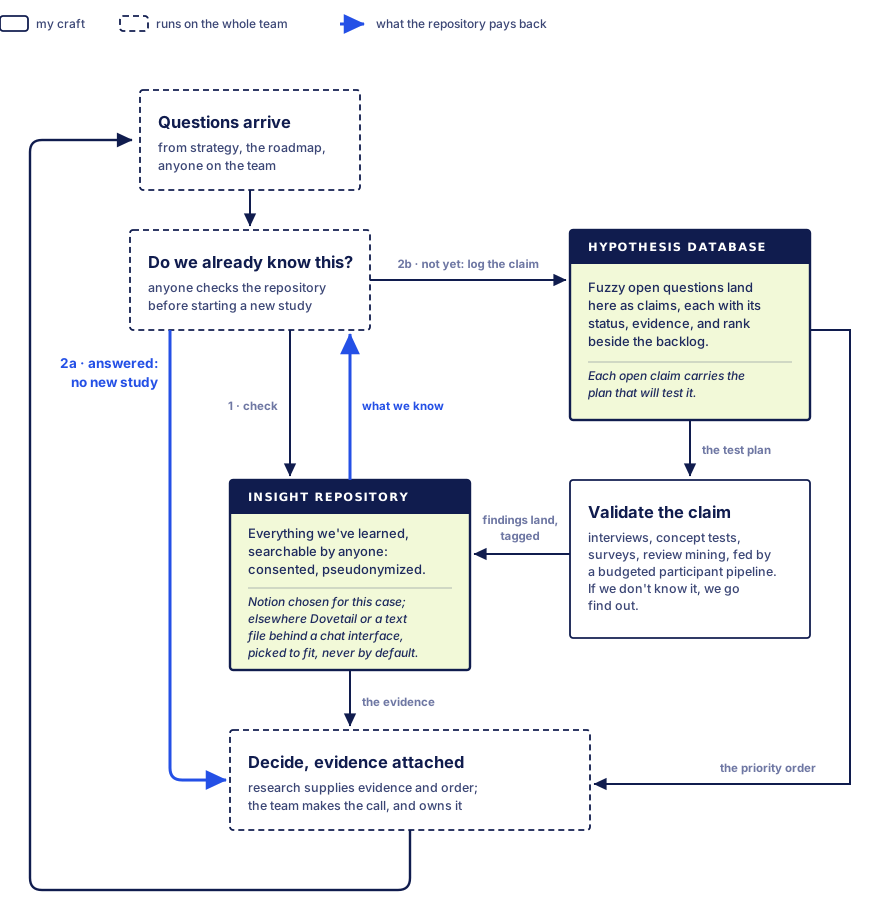
A loop diagram of the research practice. Questions from the team are checked against the insight repository. Questions already answered go straight to the decision with the evidence attached. Open ones are logged as claims in a hypothesis database, each carrying the plan that will test it, and are validated through interviews, concept tests, surveys and review mining fed by a budgeted participant pipeline. Findings land tagged in the repository, which supplies the evidence while the hypothesis database supplies the priority order, and every decision raises the next question.
Simplified graph of the system I swear by.
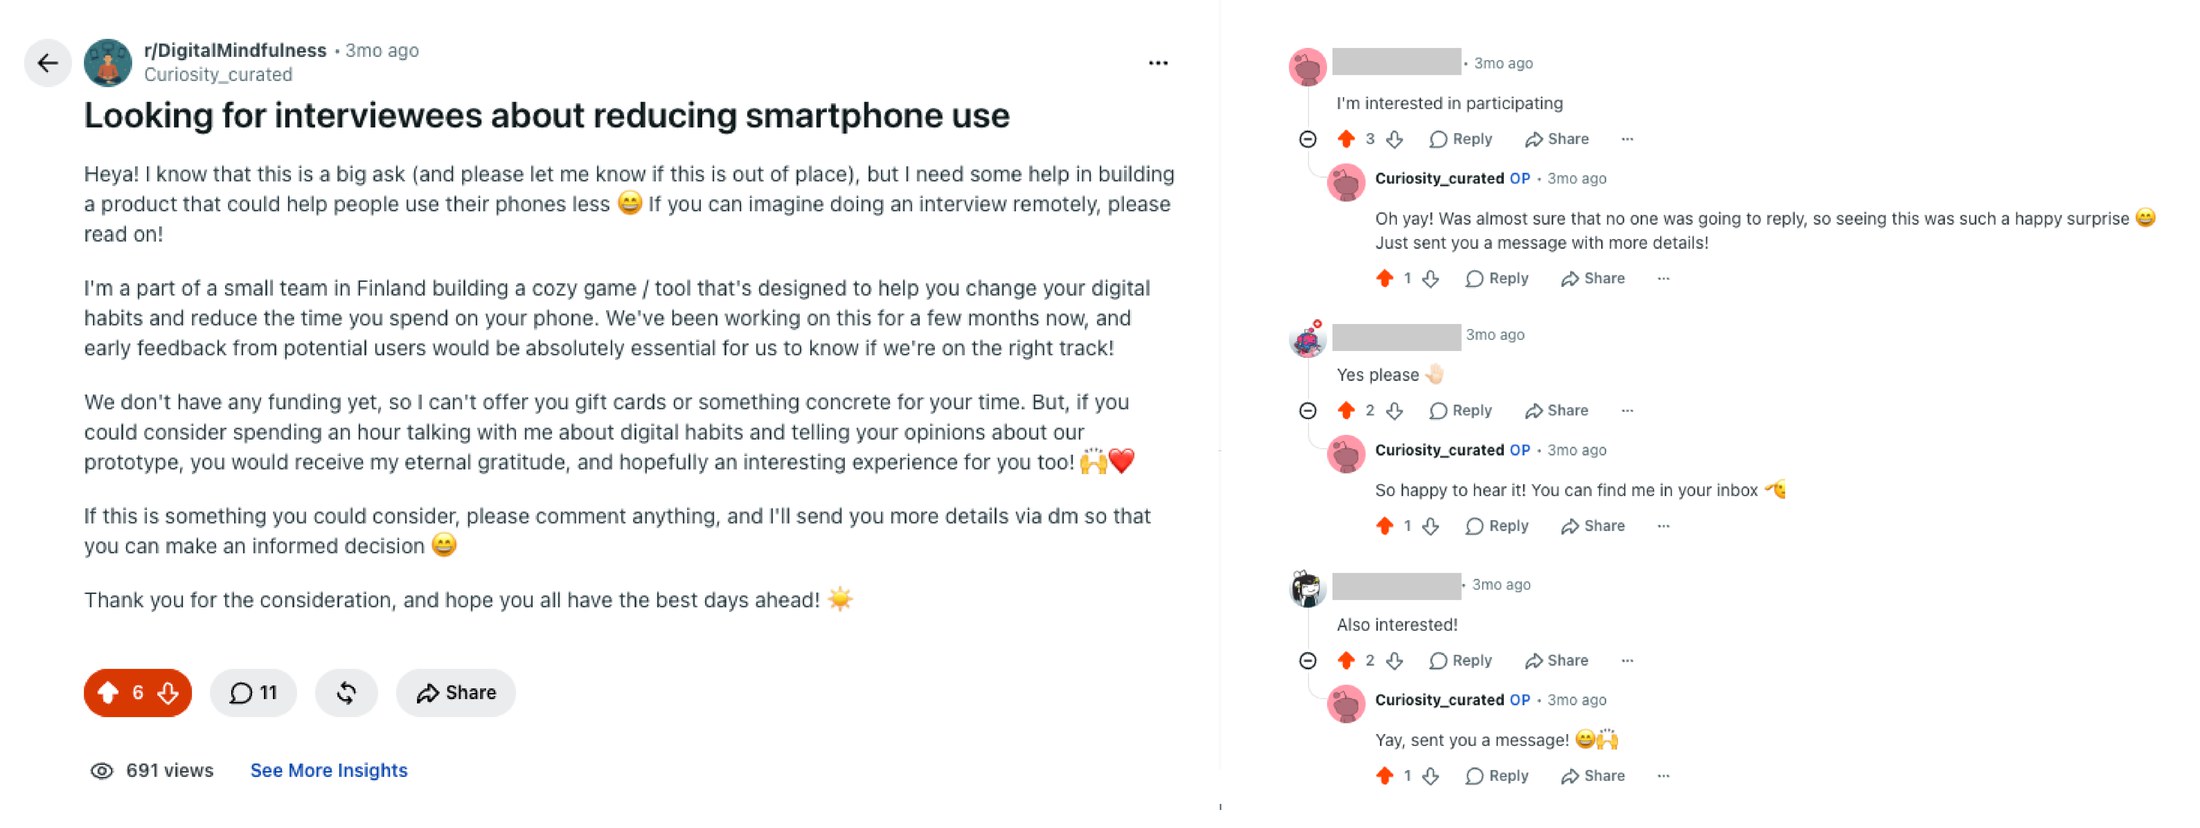
The recruiting post beside the replies it drew. The post explains that the team has no funding and cannot offer gift cards, and asks for an hour of someone's time. Three strangers answer that they are interested, and Iida replies to each personally, in one case saying she was almost sure nobody would reply. The other commenters' usernames are greyed out.
The ask, and what came back. Other commenters' names are covered; mine is not.

The storyFor a three-person team with no researcher, I picked the tooling before I built in it. The team had Google Drive and nothing else, so I moved the practice into Notion: dependencies between records, light automation, free, and fast to work in. Into it went an insight repository with a page per session, consent and pseudonymization protocols, a hypothesis database wired to the backlog, and a budgeted participant pipeline. Then I ran the first cycle: six sessions with seven participants in Finnish and English, four of them mine, working through premise, tone and mechanics in that order from screen flows on a tablet, some of which I had built myself. Recruitment mixed the team's own networks with participants recruited cold from Reddit, screened for a deliberate mix. Alongside it, a Python review-mining pipeline found the same guilt mechanic in six of seven competitor apps. The sessions had shown it too, and the team wrote it into a standing principle.

Freelance 2025–26 · Kanslo (pre-seed startup)

From Interview to Merged Pull Request

Not every research finding needs a big rebuild. Some need a small fix. Could I, a researcher new to code, build that fix myself and get it merged into the product?
MethodsResearch went in as code: an onboarding sequence built with Claude Code and opened as a pull request for the engineer to review. 14 of my commits sit in that repository.
Key findingA change delivered in directly shippable form skips the layers of approximation between a finding and a fix.
What changedThe engineer reviewed and merged the work, and the onboarding sequence I built from the interview insights is the app's opening.
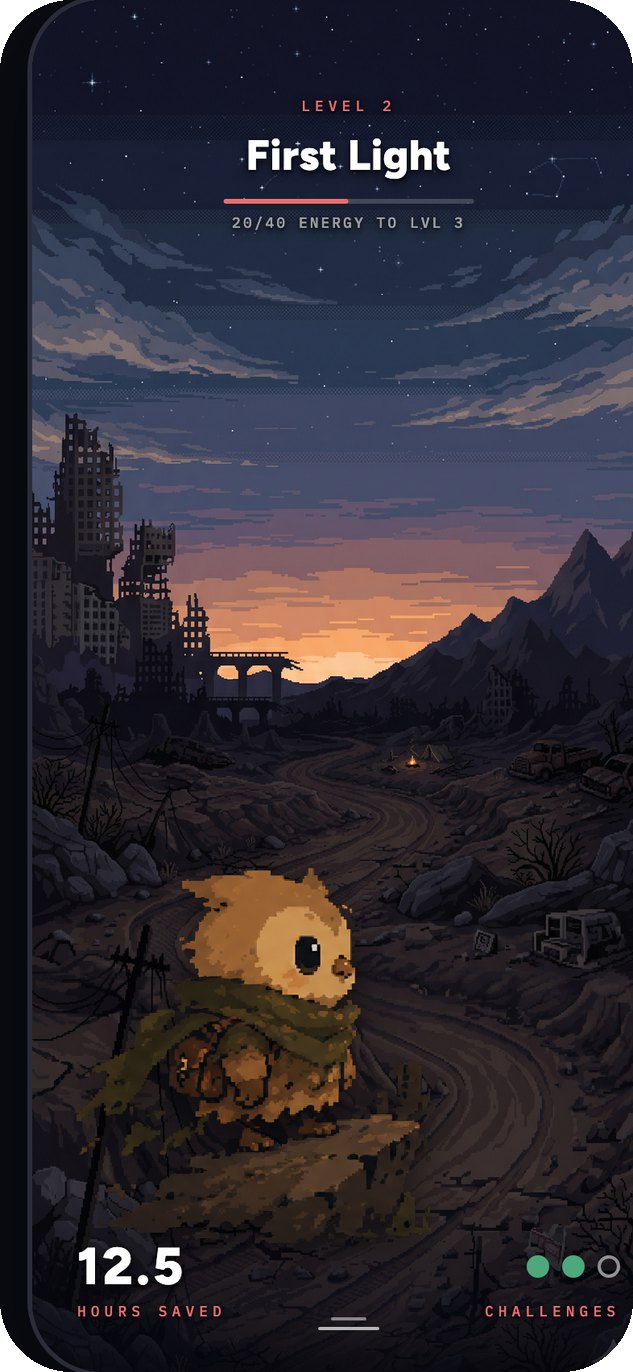
Phone frame showing the app's dashboard at level two, First Light: a pixel-art companion in a landscape at dusk, an energy bar toward the next level, and an hours-saved counter reading 12.5
The product the work shipped into. The art assets were also generated by me as placeholders for concept testing.
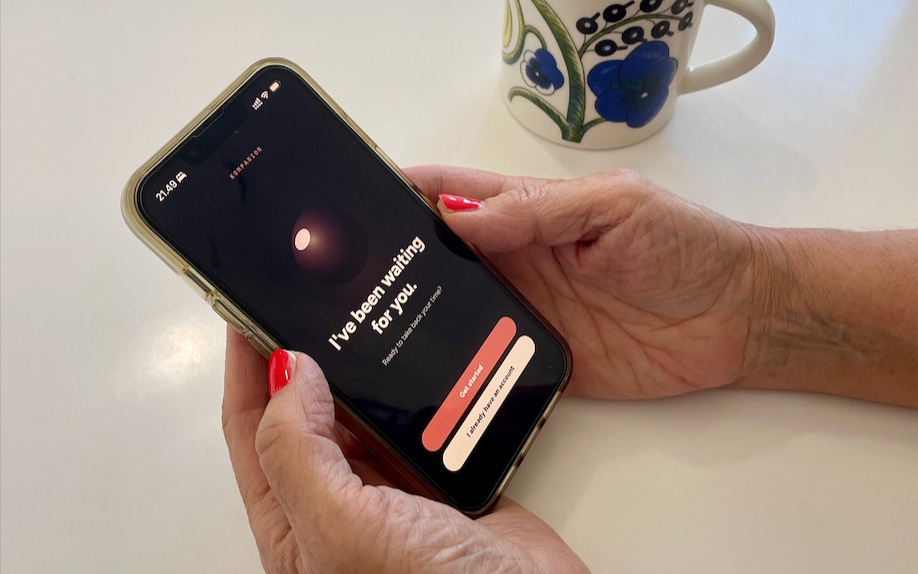
A user interview participant holding a phone with the onboarding prototype, over a white table beside a patterned mug. The app's dark welcome screen reads: I've been waiting for you. Ready to take back your time? Below are two buttons, Get started and I already have an account.
A participant testing the onboarding prototype during a user interview.

The storyWith the practice standing, I carried findings from my own interviews the rest of the way myself: a new onboarding sequence that I designed, built with Claude Code, and opened as a pull request. The division of labour was explicit. I directed and reviewed every change, the agent wrote at my pace, and the engineer held the merge. Research is where I expect to spend my time. When the fix is within reach, I would rather build it than describe it. From daily practice I know where trust in an agent is earned, when to take control back, and how errors get caught.

Freelance 2025–26 · Kanslo (pre-seed startup)

The Empty Corner of a Crowded Category

Every way the team proposed to position the app quietly assumed something about its competitors. Nobody had mapped them. What did the competition actually look like?
MethodsA competitive map from seven competitor briefs, six interviews and the literature, on two axes I had to define first. Each candidate positioning drawn as the claim it made about everyone else. Written up as a decision memo with Claude Code.
Key findingSaying “we are like this” always says “they are like that”. Once that was on paper, the team disagreed about how to categorise the competitors, and that disagreement was the useful conversation. A static category didn't survive it.
What changedThe team took the second map forward and began treating positioning, ours and the competitors', as situational and in need of adjustment rather than a corner to own.

Same seven competitors, same horizontal axis. Only the vertical question changes.

NOBODY HERE builds capability and expects to be outgrown restrictors gamified / compulsive GRADUATION UTILITY COMPULSION ↑ design intent for the user–product relationship the goal TOO MUCH RIGHT AMOUNT TOO LITTLE CANDIDATE POSITION B sustained right amount CANDIDATE POSITION A during the programme, then less ↑ how much users end up using the product environment action the person ← depth of intervention: what does the product actually change? →

THE INSTRUMENT. The vertical axis is design intent: what each product is built to do to its user. Seven competitors placed from their briefs, six interviews and the literature. Left to right is what a product changes: the environment, the action in the moment, or the person's own capability. The empty corner was the provocation.

STRUCTURAL SKETCH, NOT A BENCHMARK. Placements are inferred from the synthesis: user reviews, longitudinal complaints and fade-out patterns. No product in the category publishes the outcome data this lens would need to be rigorous. The signal is real but the precision is low. The two candidate positions are claims about what the design could achieve, not verified outcomes.

CLIENT WORK. COMPETITORS AND THE PRODUCT'S OWN CANDIDATE POSITIONS ANONYMISED HERE.

Both maps from the memo, redrawn on one frame. Choosing the two axes was the analysis; placing the competitors on them took an afternoon. Map B keeps the horizontal axis and asks a different question on the vertical: not what a product is, but whether users end up using it the right amount. Map B is the one the team took forward.

The storyNobody had made the disagreement tangible, so I did. My job was not to gather new data but to force the evidence we had, seven competitor briefs, six interviews and the literature, into a shape that could be argued with: two axes, every competitor placed on them, and each position the team had been proposing drawn as what it implied about the rest of the field. Having something concrete to challenge clarified the conversation. The arguments over where a competitor belonged surfaced the assumptions the weeks of debate had been circling. The second map, which asks whether users end up using each product the right amount, is the one the team kept. It reframed positioning from a category to hold into a position that moves with the situation. I labelled it a structural sketch rather than a benchmark, because nobody in this category publishes outcome data.

Freelance 2025–26 · White-label engagement

Scaling Qualitative Analysis with AI

An organization wanted to know how its people really communicate, and where the culture gets stuck. What can millions of messages show that a handful of interviews can't?
MethodsA statistical sweep of 2.8 million messages, then AI-assisted coding of the exchanges the numbers flagged, validated against my own hand-coding, and a hypothesis matrix rated by strength of evidence.
Key findingFull-dataset analysis surfaced tensions no interview sample would have caught, and located them in specific parts of the organization.
What changedLeadership workshopped the findings into a five-point action plan for the communication culture.

Chart forms from the analysis

A · VOLUME PER PERSON AGAINST WHEN THEY ARRIVED the tail the numbers flag for close reading more none MESSAGES POSTED earliest accounts newest accounts ONE DOT IS ONE PERSON B · THE SAME PEOPLE GROUPED INTO ARRIVAL COHORTS MEAN MESSAGES first cohort most recent cohort ONE BAR IS ONE QUARTER OF NEW ACCOUNTS

ILLUSTRATIVE. THE FORMS ARE FROM THE STUDY; THE DATA DRAWN HERE IS INVENTED. CLIENT FIGURES AND FINDINGS REMAIN CONFIDENTIAL.

The two instruments the sweep ran on, drawn with invented numbers. The scatter finds the few people who carry most of the volume; the cohort bars turn individual noise into a comparison between groups.

The human–AI analysis loop

1 · FRAME Researcher sets thequestions, codebook 2 · EXTEND AI codes the wholeset, not a sample 3 · VALIDATE Every batch againsthand-coded samples 4 · INTERPRET Researcher reads:findings, tensions a batch that disagrees sends the frame back to step 1
The workflow I validated in my thesis and now use commercially. The return edge is what makes it a loop: a batch that disagrees with my hand-coding sends the frame back to step one.

The storyWorking white-label as the research engine behind a partner consultancy, I owned the analysis pipeline, synthesis and reporting. Three kinds of evidence met: platform statistics across thirteen months and roughly 750 people, the partner's employee interviews in Finnish and English, and close discourse analysis of seven episodes the numbers flagged, over 400 messages coded one by one. The coding ran on the human-AI workflow from my master's thesis: I set the frame, AI extends the coding across the full dataset, every batch is checked against hand-coded samples, and interpretation stays human.

Independent consultant 2020–21 · We Foundation

Three Months Inside a Community House

A community house in Helsinki works to reduce social exclusion among families. Who are the families it serves, and what do they need from it?
MethodsSole researcher end to end: a survey I designed, three months of participatory observation, and in-depth interviews with six families and local social-services professionals.
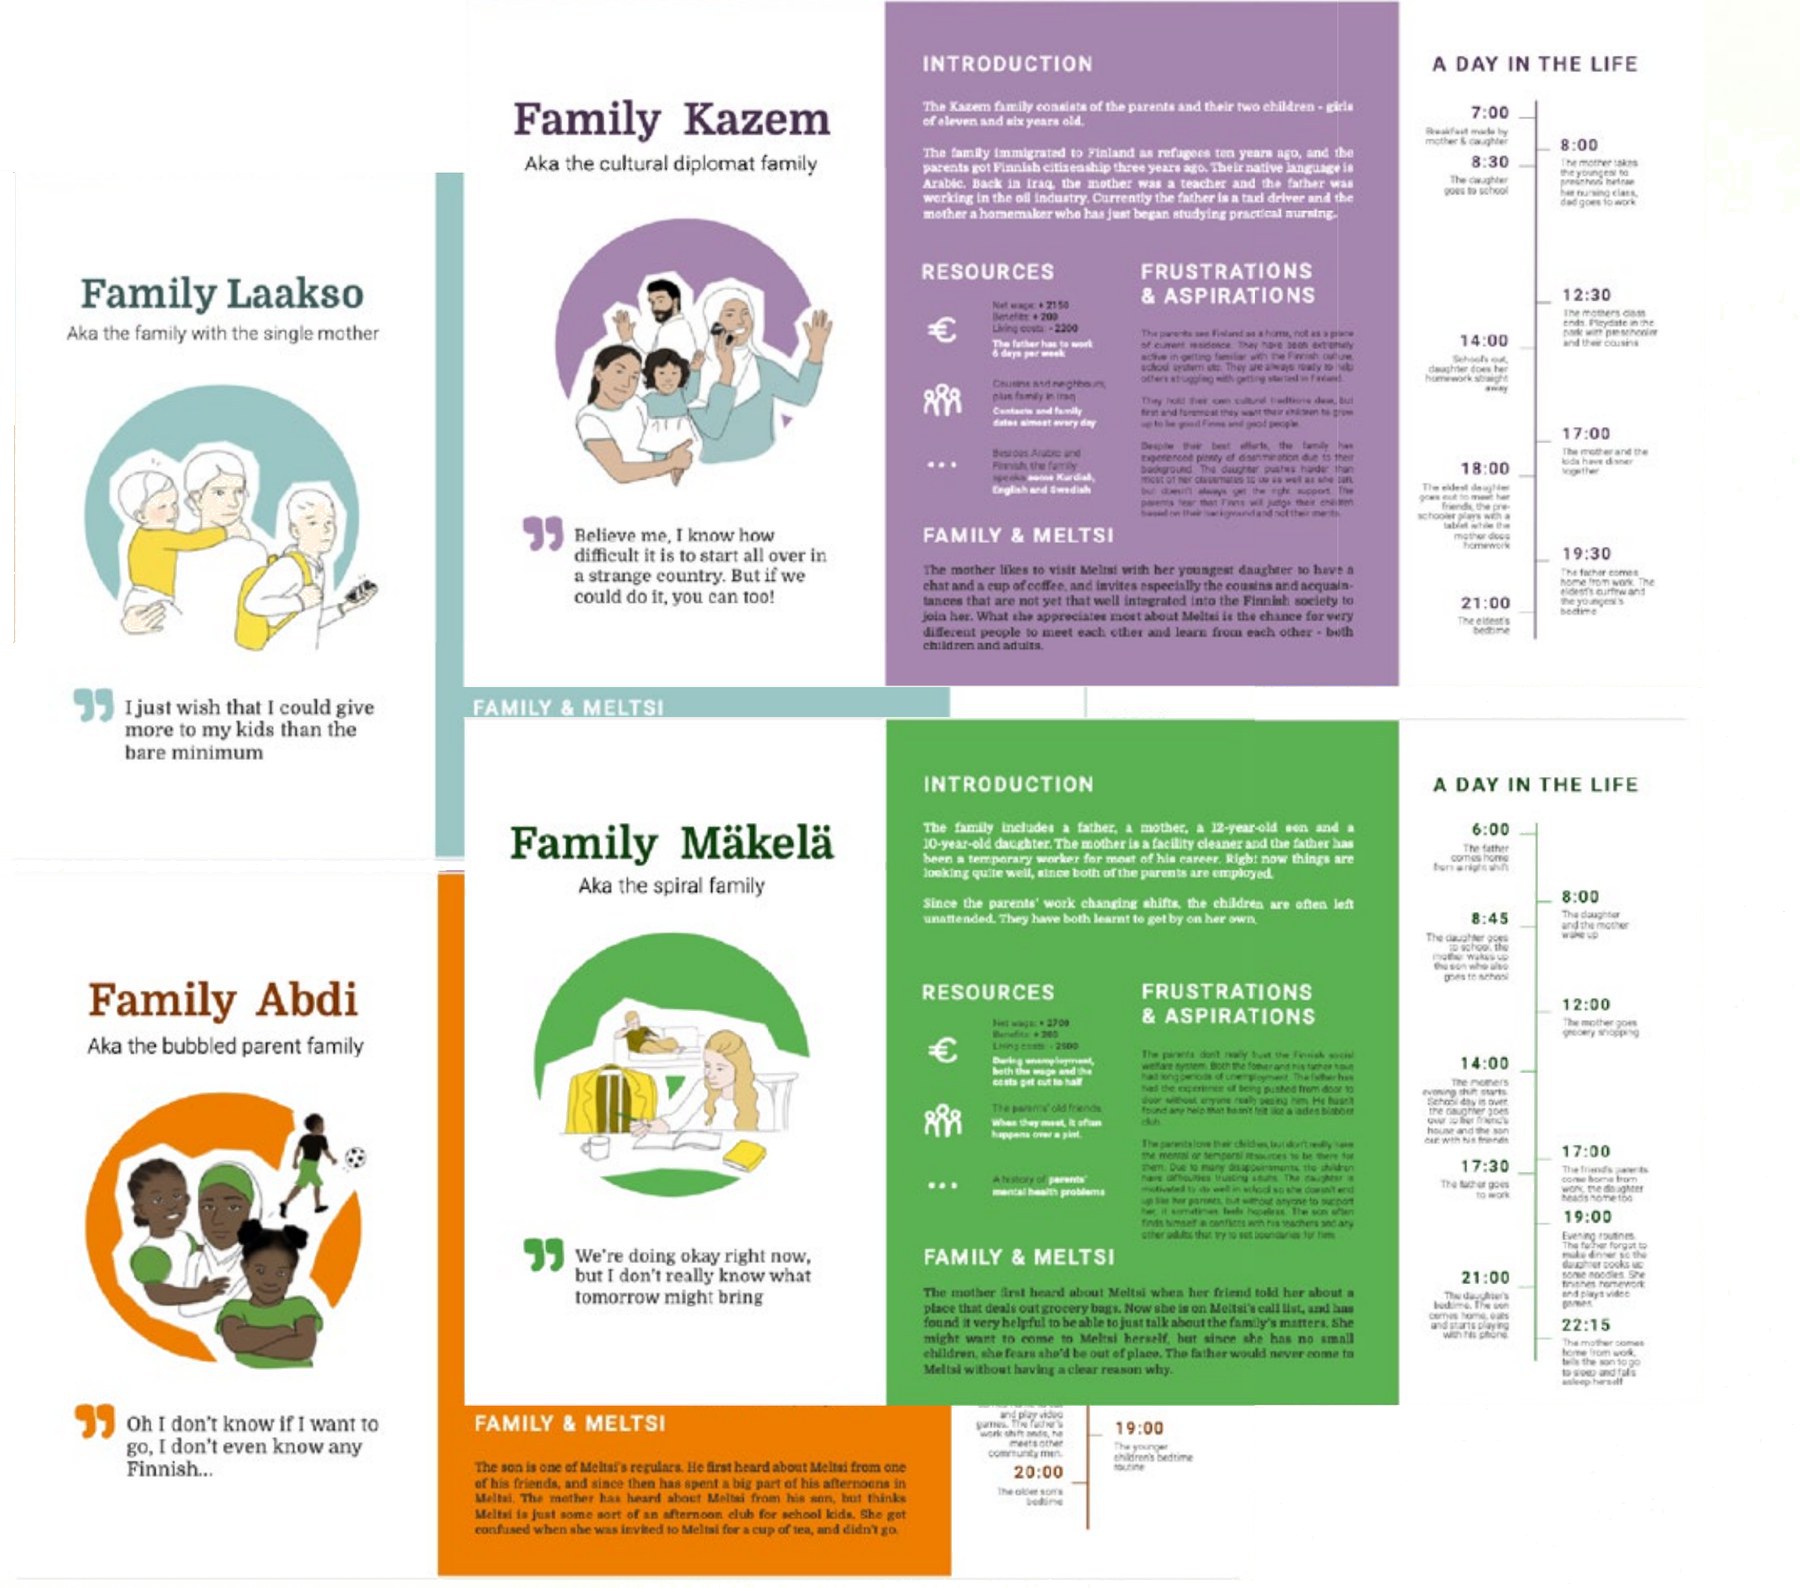
Key findingClient families sort into four archetypes with different needs of the house. I drew each one as a persona so staff could use them.
What changedPresented company-wide, it set off hours of discussion about how staff relate to client families. The client commissioned a follow-up.
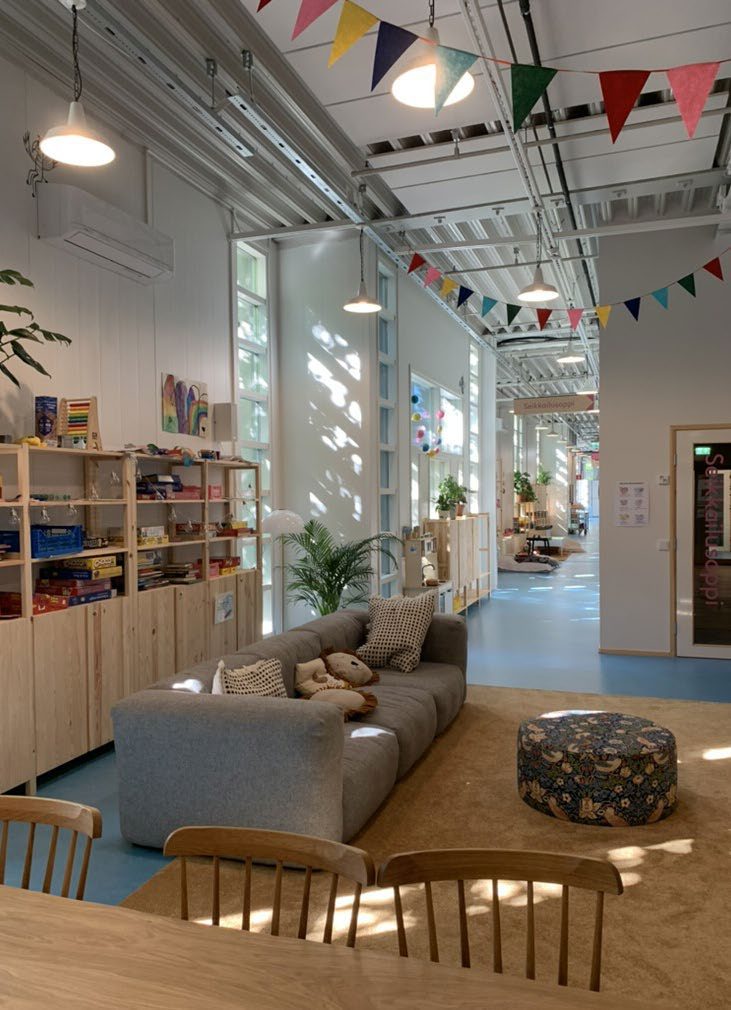
Interior of the We House Meltsi community house in Helsinki with bunting, toys and a reading corner
We House Meltsi, the community house I studied
Four illustrated persona cards, families Laakso, Kazem, Abdi and Mäkelä, each colour-coded and carrying an introduction, resources, frustrations and aspirations, a quote, and a day in the life
All four archetypes as delivered, overlapping: families Laakso, Kazem, Abdi and Mäkelä.

The storyWe House Meltsi is a community house in Helsinki, run by a startup working to reduce social exclusion among families. As sole researcher I spent three months embedded in the house: a survey I designed and analysed myself, participatory observation, and in-depth interviews with six families, sanity-checked with local social-services professionals. Families whose first language was neither Finnish nor English participated through digital translators and methods designed so language never gated participation. That constraint shaped the instrument rather than the sample: the questions got simpler and more concrete, and the interviews got longer.

Selected work

Beyond Consulting

Master's thesis 2025 · KU Leuven

Watching a Discourse Turn Hostile

How has Finnish social media talked about climate migrants over fifteen years, and how do you make an AI-assisted analysis of it trustworthy?
Methods1,374 posts spanning 2009–2025, clustered with BERTopic on a Finnish-language transformer model and interpreted with LLM-assisted thematic analysis I validated topic by topic.
Key findingSix framings, with the discourse turning from solidary and sensemaking to alarmist, cynical and nativist over the past decade.
What changedThe human-AI workflow became the validated method I now use in commercial work.
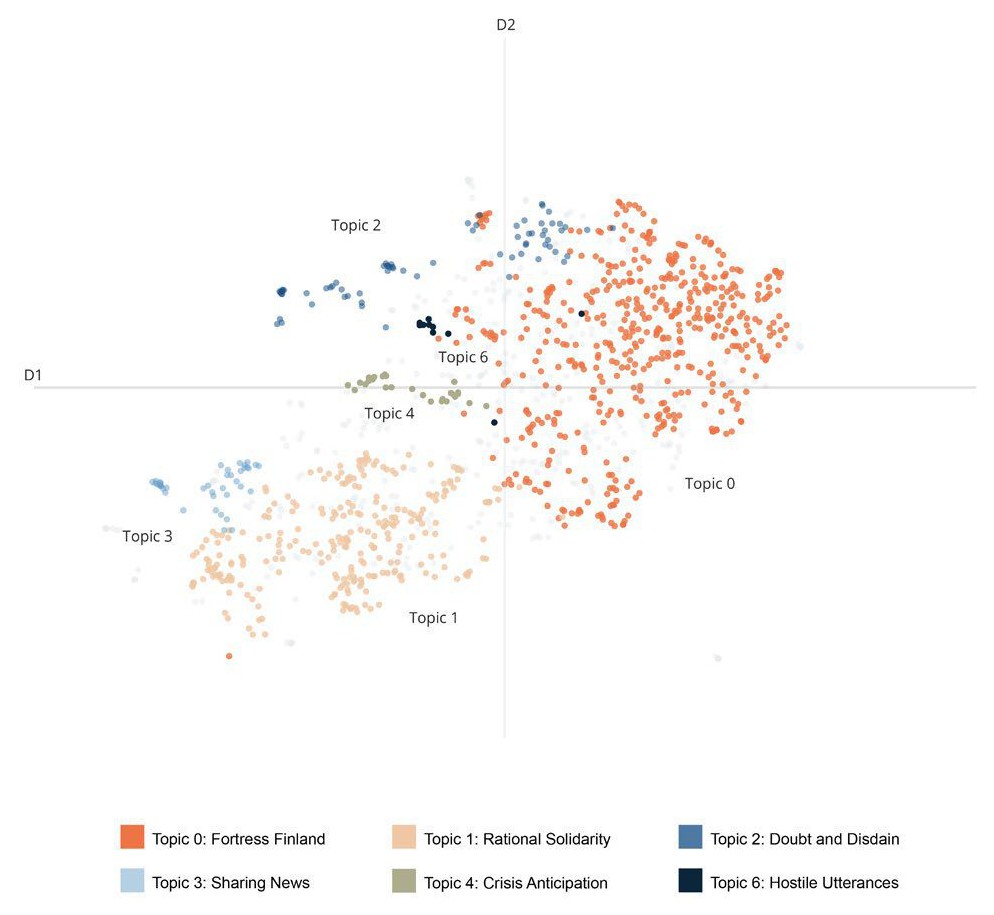
Scatter plot of post embeddings coloured by topic, showing semantic distance between the six discourse framings
Post embeddings coloured by topic: how far apart the six framings actually sit
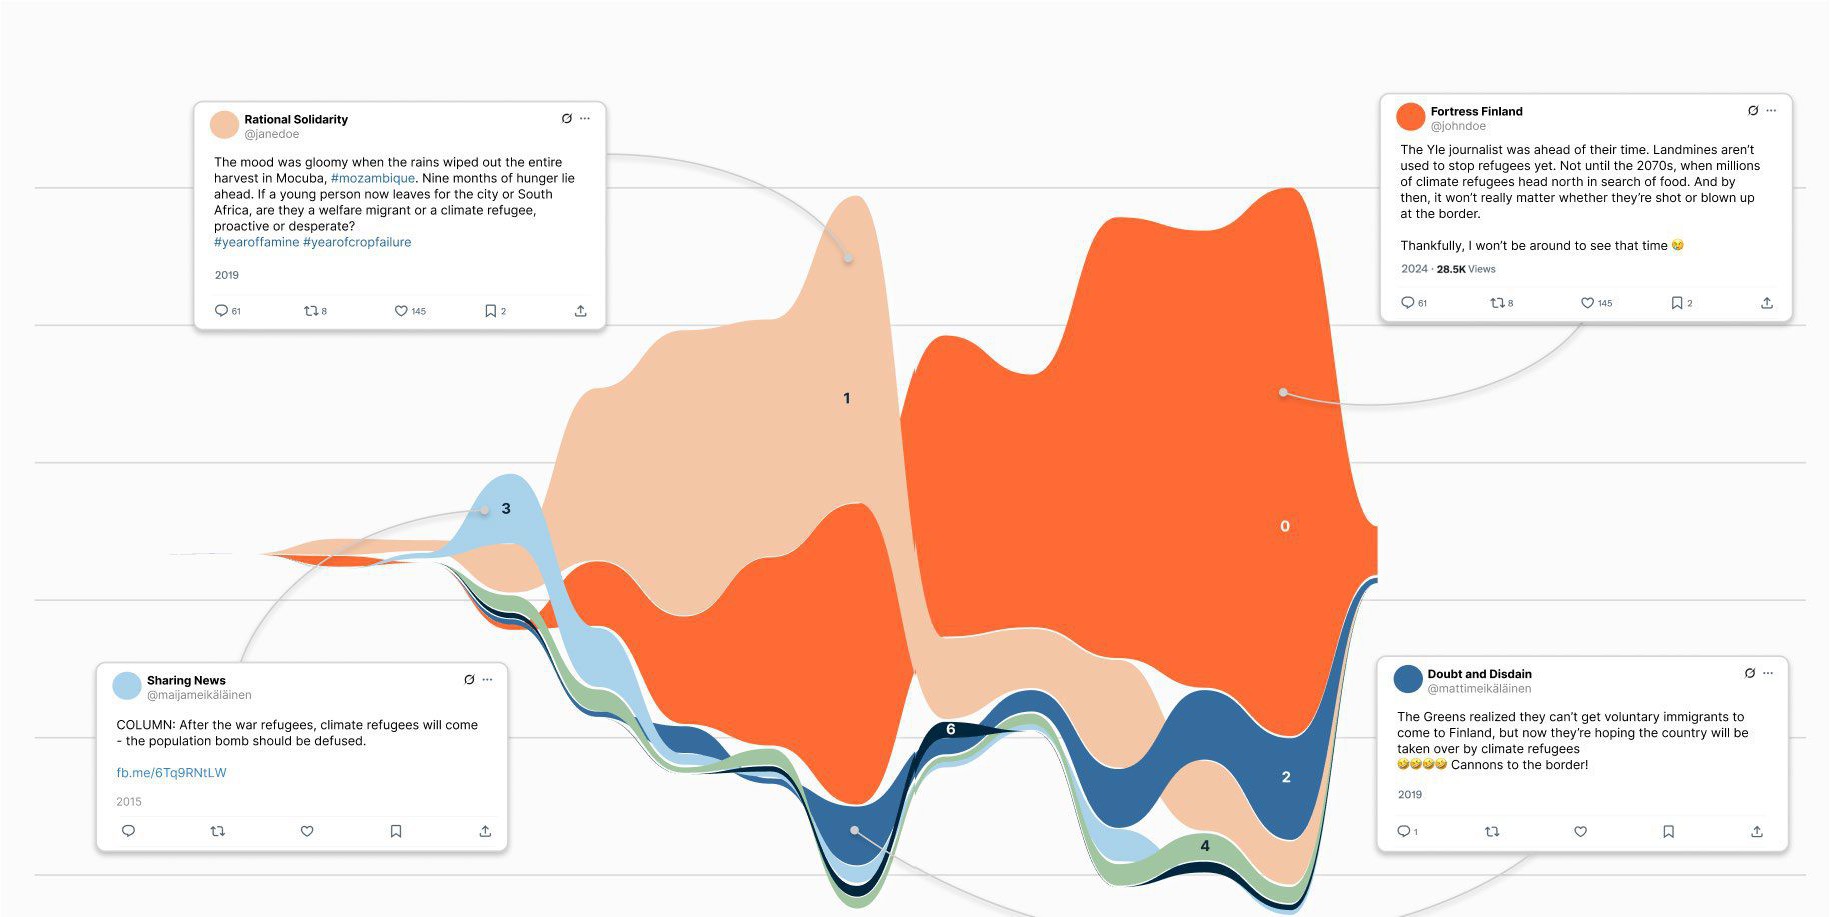
Stream graph of six discourse topics about climate migration in Finnish X posts, thin in the early years and widening over time, annotated in place with four reconstructed example posts dated 2015 to 2024
Topic prevalence from 2009 to 2025. Example posts are reconstructed and anonymized, and sit at the moment they belong to.

The storyA solo computational study. I built a Finnish-language corpus of X posts on climate migration from 2009 to 2025 with a keyword-based query, clustered it with BERTopic on a Finnish-language transformer model, ran the statistics in R, and checked the model's reading of every topic against my own hand-coded samples. Most of that work is deciding when to trust the model and how to catch its errors, and those questions have followed me into every AI-assisted project since. Full text available upon request.

Side project 2026 · Rairai ristikot

A Crossword App in Three Days

My friends and I wanted to make crosswords for each other. How hard could it be to build an app for that?
MethodThree documents before any code: rules for the AI pair, a roadmap where every decision carries a date and a reason, and one spec per feature with a phone walkthrough. The look was settled in 13 sketch rounds, one question at a time.
What was builtA Finnish-style crossword app for a closed group of friends: a pile of sheets on a desk, a solver on the phone's own keyboard, a boundless creator with drawn clues, magic-link login, live on Cloudflare Pages. 68 dated decisions, 91 engine tests, three days.
What I learnedThe method is the product. With rules, roadmap and specs in place, the AI writes the code and I make the calls: what the home screen is, what the stamp does. Friends' phone tests became the next dated decisions.
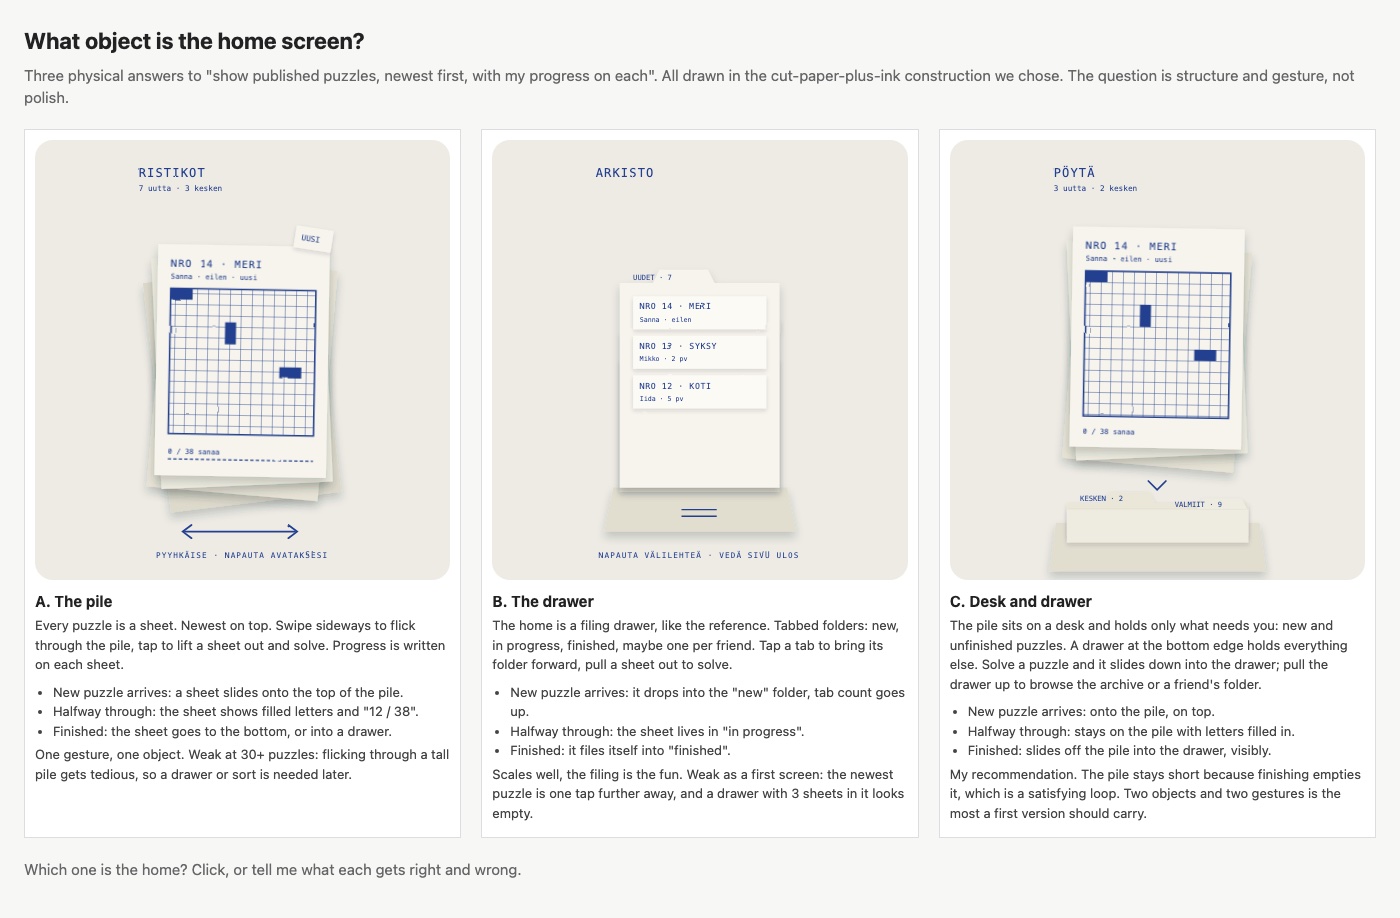
A sketch page titled What object is the home screen, with three drawn options side by side: a pile of cream puzzle sheets on a desk, a filing drawer with tabbed folders, and a desk with a pile and a drawer beneath it, each with a short note on what it gets right and wrong
Two sketch rounds. Above, from the design session on 14 September 2026: three drawn answers to what the home screen is. The pile won; the drawer waits on the backlog. Below, the comments feature a day later: the sheet turns over to its comments, and the sliders set how the paper bows, where it hinges and where the arrow lands.
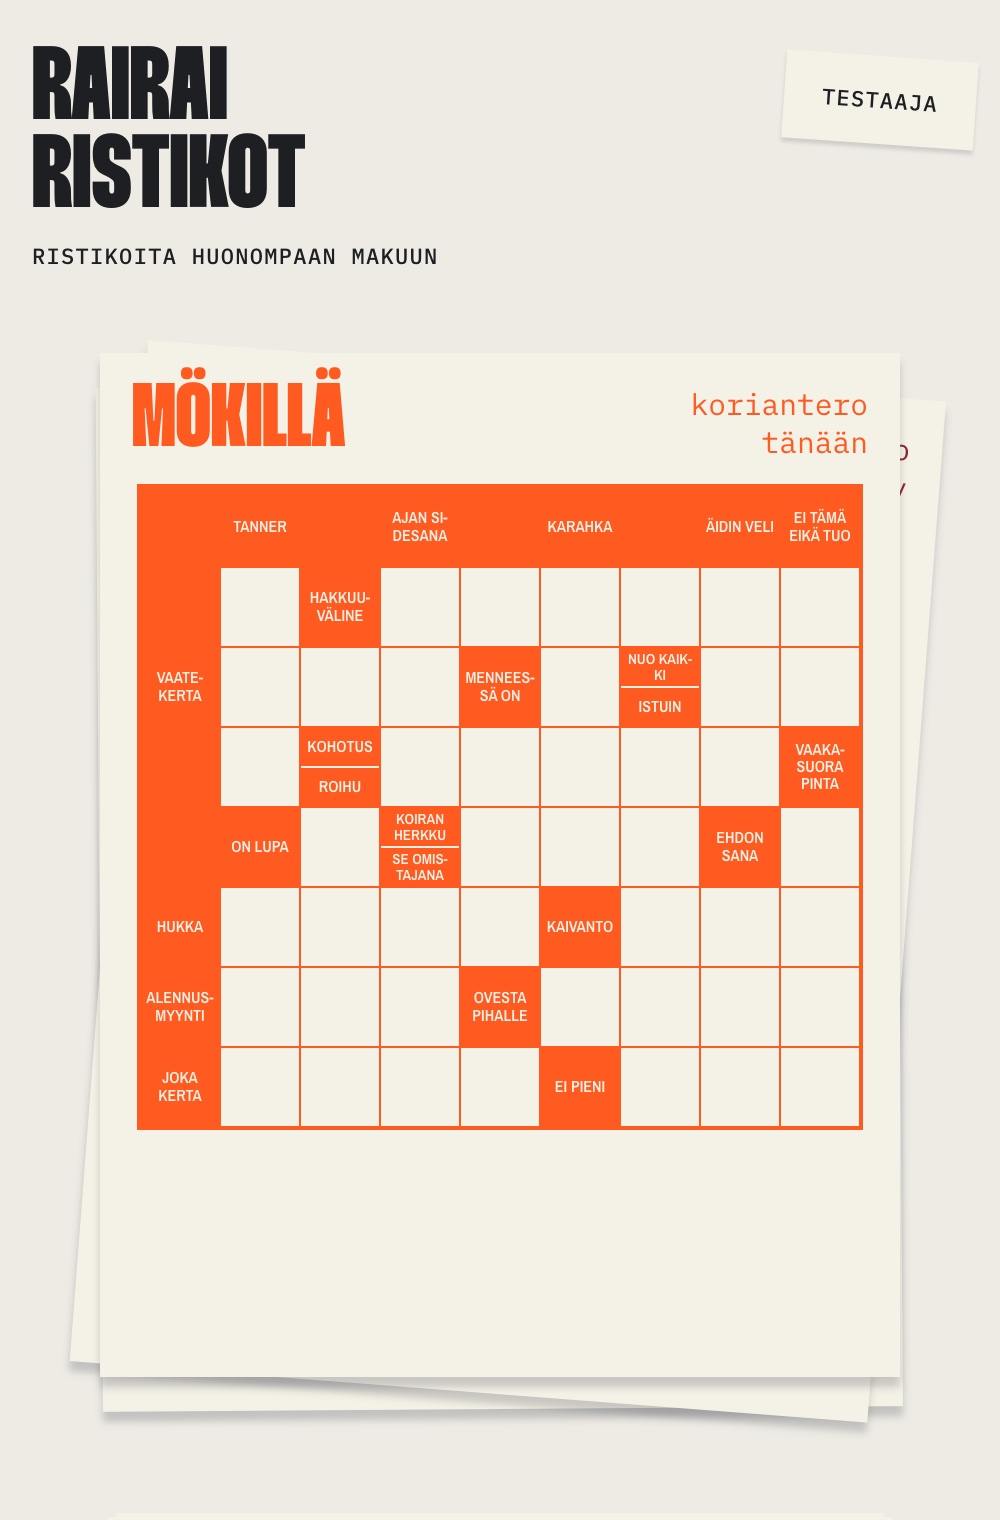
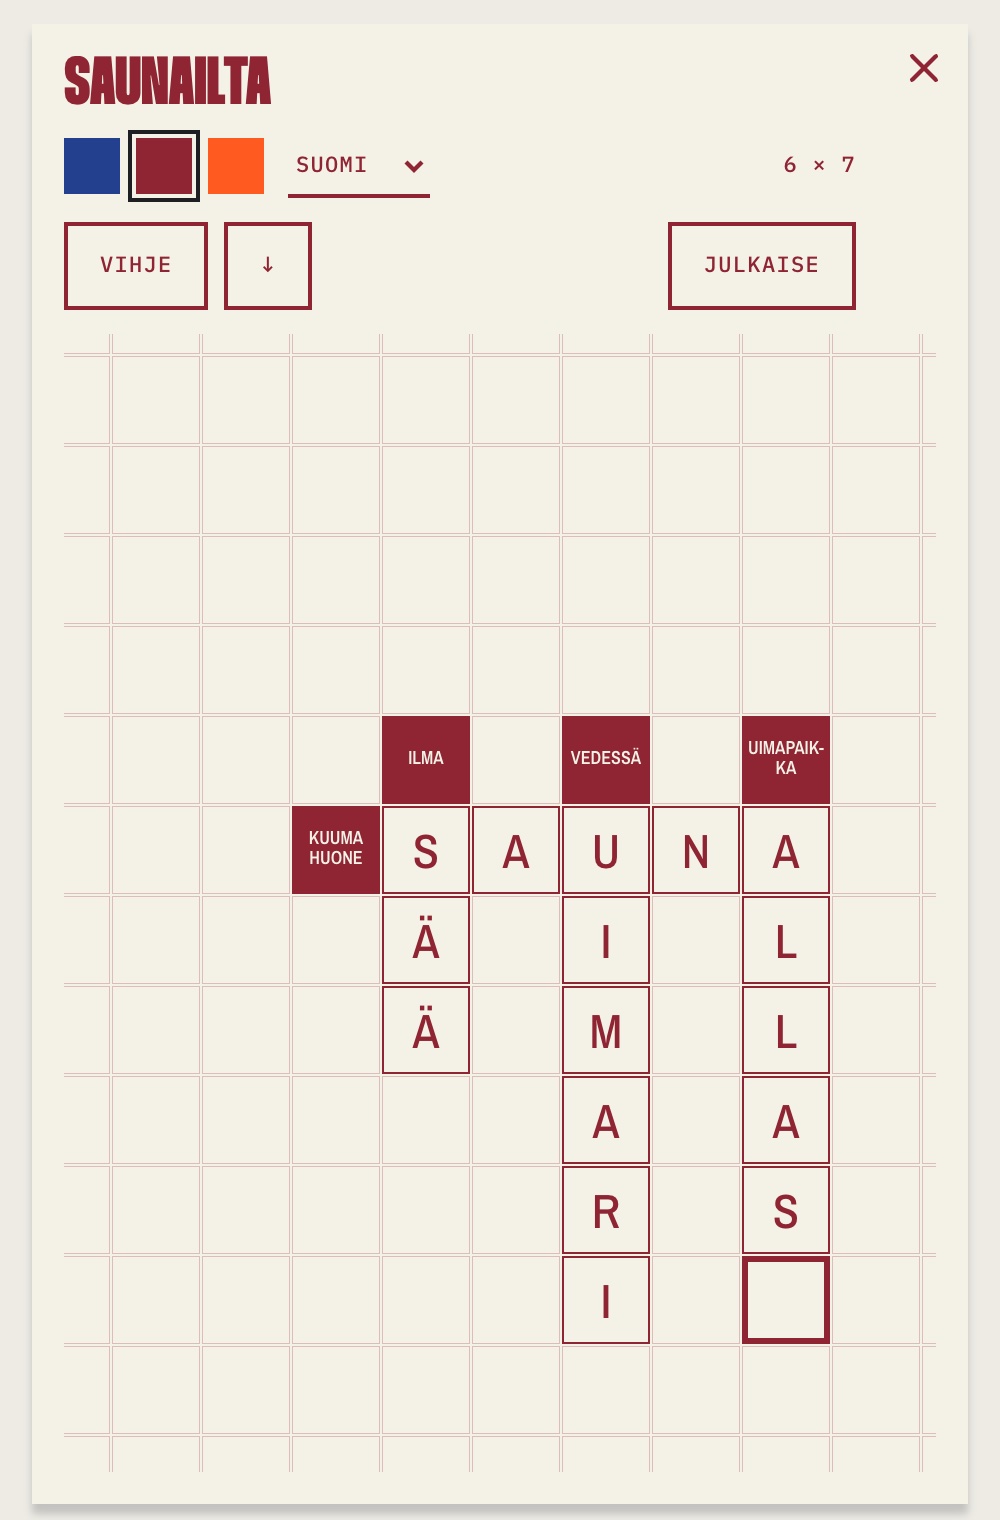
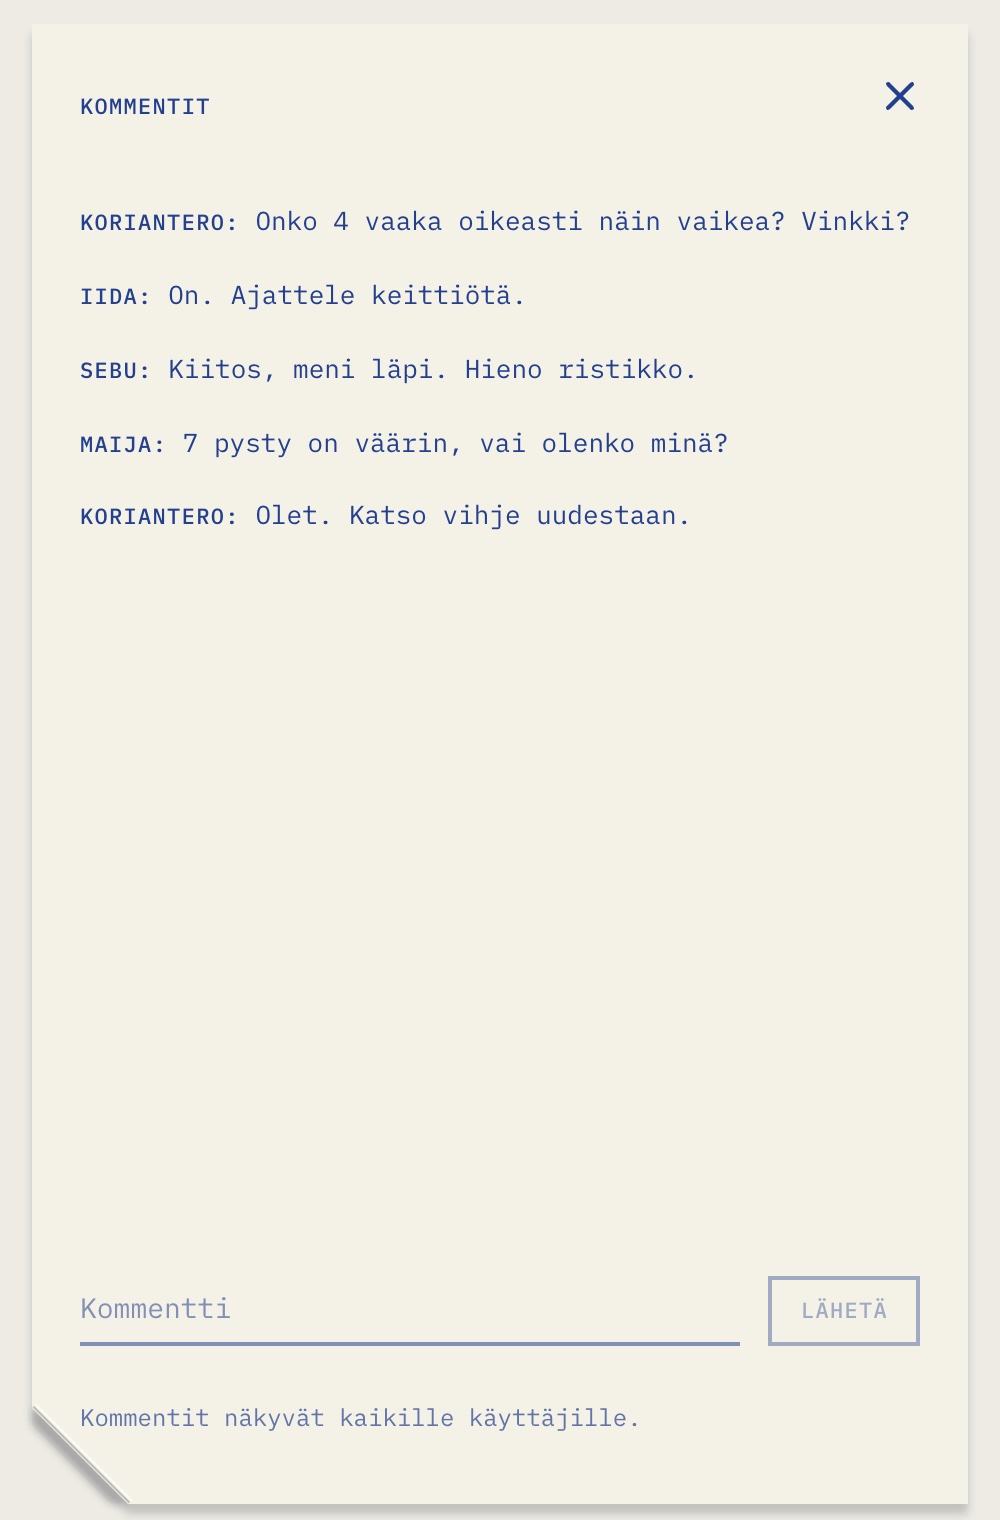
The app on a phone: the Rairai ristikot heading in heavy black type, a pile of cream puzzle sheets slightly askew with an orange crossword grid on the top one, and a pad of grid paper beneath labelled Uusi ristikko The creator on a phone: a sheet in wine red ink titled Saunailta on faint grid paper, with the words SAUNA, UIMARI, SÄÄ and ALLAS crossing, four ink clue cells, the cursor on the next empty square, and the ink, language, clue and publish controls above The back of a navy sheet on a phone: the heading Kommentit, five short comments from friends in navy type, each under its author's name, and a line at the bottom for writing a new one
The app on a phone: the pile on the desk, a puzzle being built in the creator, and a sheet turned over to the comments on its back.

The storyA kitchen-table idea: friends who make crosswords for each other and wanted them on a phone. The first evening set up the working method, the second day was the design session, and the app was live on the third, with a privacy notice, a fake backend for login-free previews and a browser rig that clicks through every screen on desktop Chromium, Android and iPhone. A few friends have tested it on their phones. Try the desk below: a preview build with example puzzles and no login.

The Rairai ristikot desk in a browser: the heading top left, a pile of cream sheets in the middle with an orange crossword on top, and a pad of grid paper below it
or open it in a new tab ↗
Rairai ristikot, live in the page. Flick through the pile, lift a sheet and type, or tap the pad to make a puzzle. A preview build with example puzzles, so nothing you do here reaches anyone.

2024–present · Idle

Design Entrepreneur

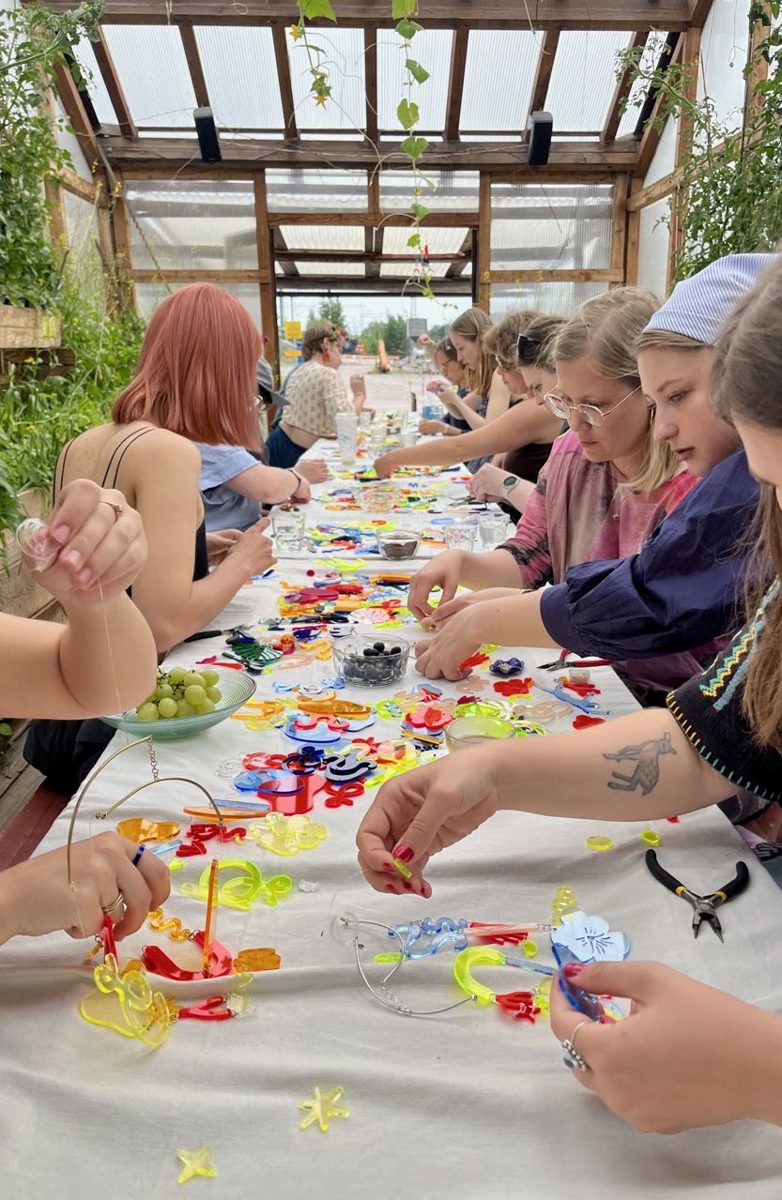
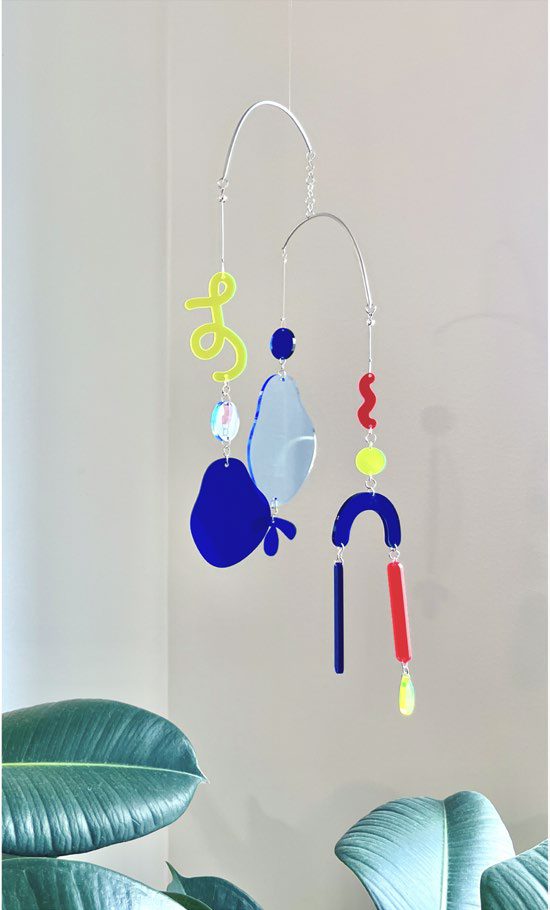
In 2024 I designed a modular system for building colourful acrylic suncatcher mobiles, and I have run Idle alongside my client work ever since. Hundreds of homes around the world now have Idle mobiles made in my public and company workshops, with some participants returning as many as five times. Every workshop doubles as a live product test.

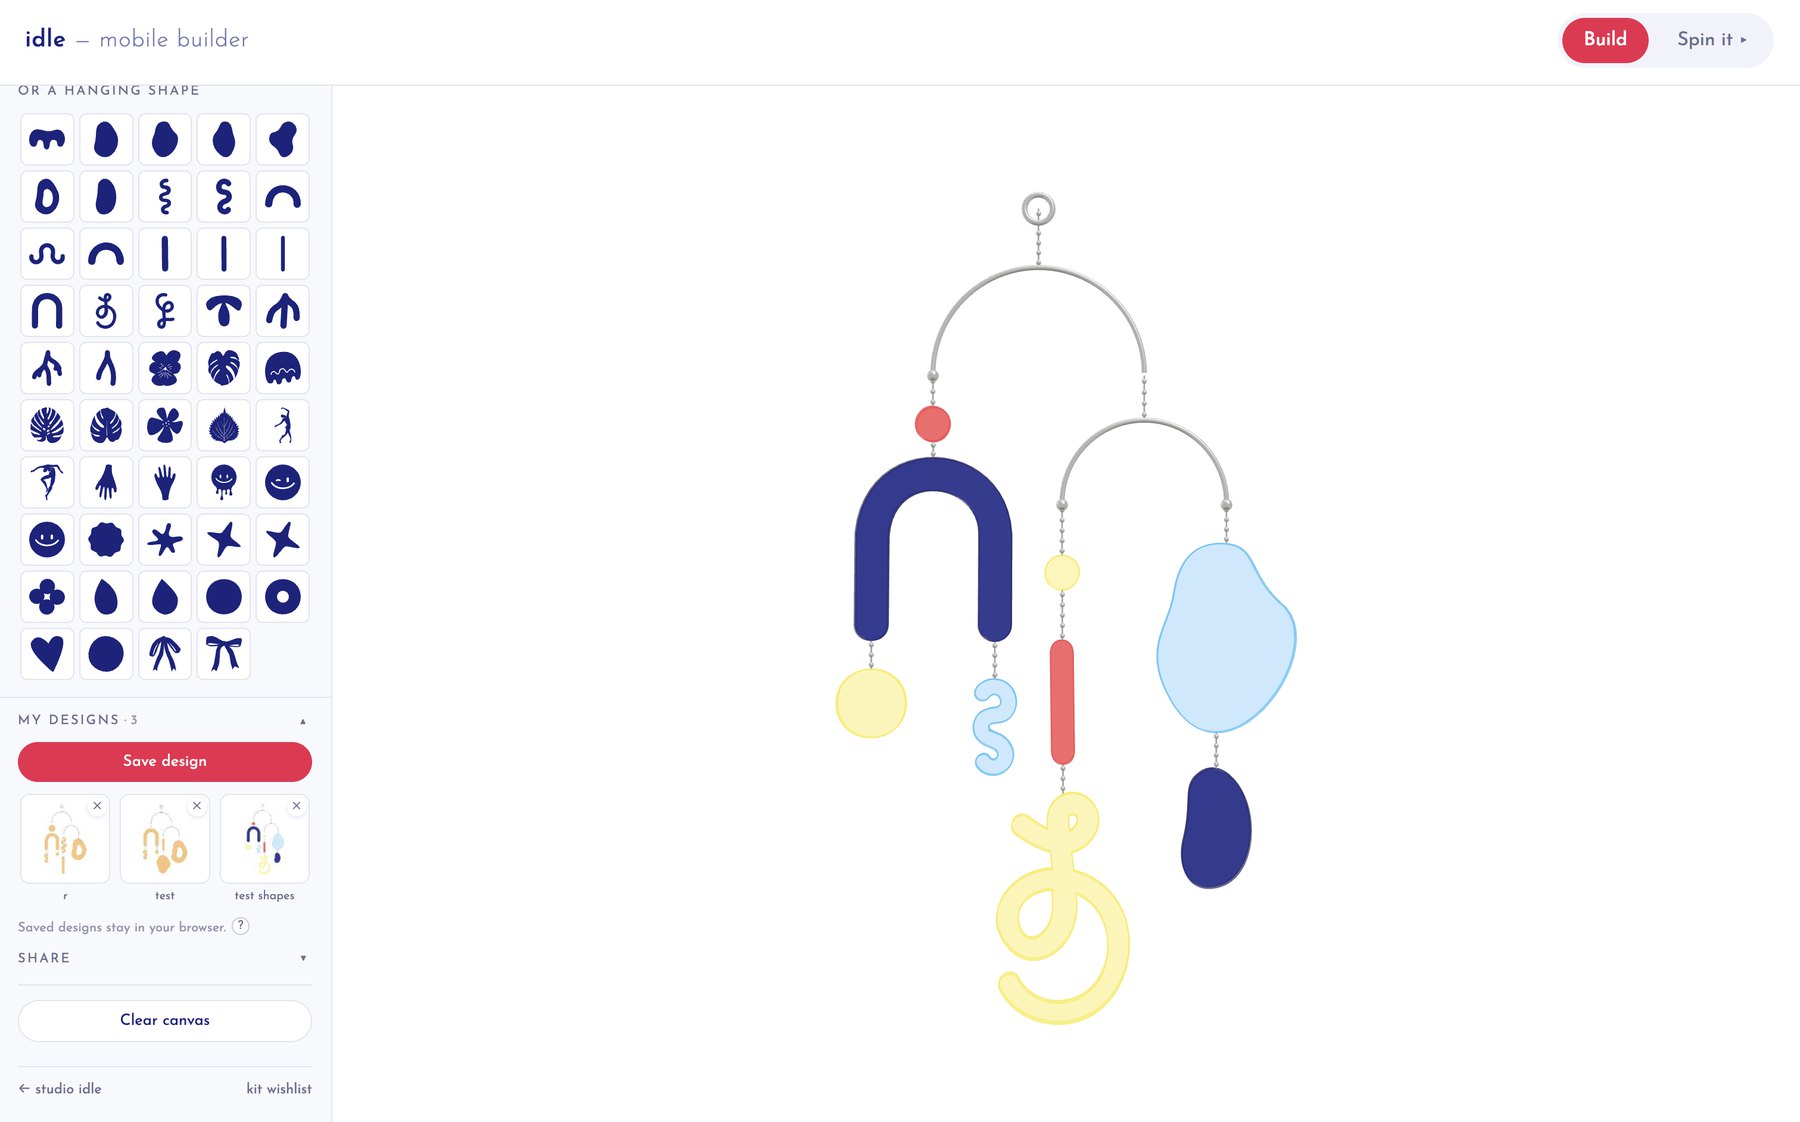
I build the tooling too. The Idle Mobile Builder is a live browser tool with a real physics simulation, made with Claude Code, doubling as the customizer for custom orders: builder.studioidle.com. More of the physical work at instagram.com/idle.along

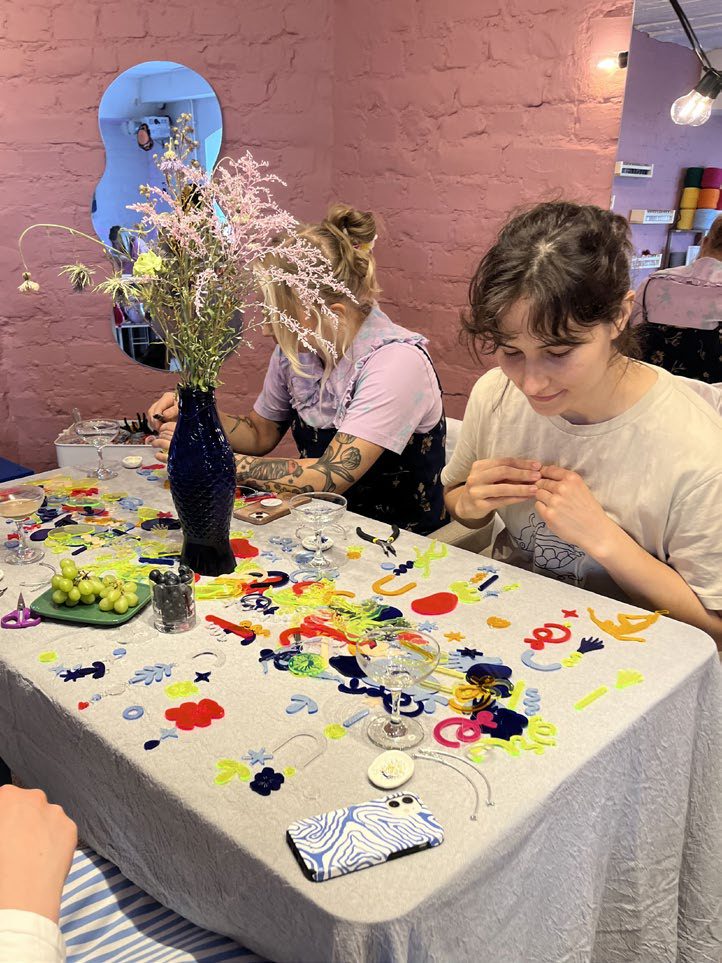
Participants assembling colourful acrylic suncatcher pieces at an Idle workshop table An Idle workshop in a greenhouse, long table covered with acrylic shapes Finished acrylic suncatcher mobile hanging by a window
The Idle Mobile Builder in a browser: a scrolling library of navy shapes down the left with a saved-designs panel beneath it, Build and Spin it controls in the header, and a two-tier mobile hanging in the canvas with navy, yellow, red and pale blue shapes on beaded chains
or open it in a new tab ↗
The Idle Mobile Builder, live in the page. Drag shapes onto the frame, press Build and the simulation balances and spins the result; the design saves to a shareable link before any acrylic is cut.

Founder 2017 · Aaltoes: Dash

Founding a Design Hackathon

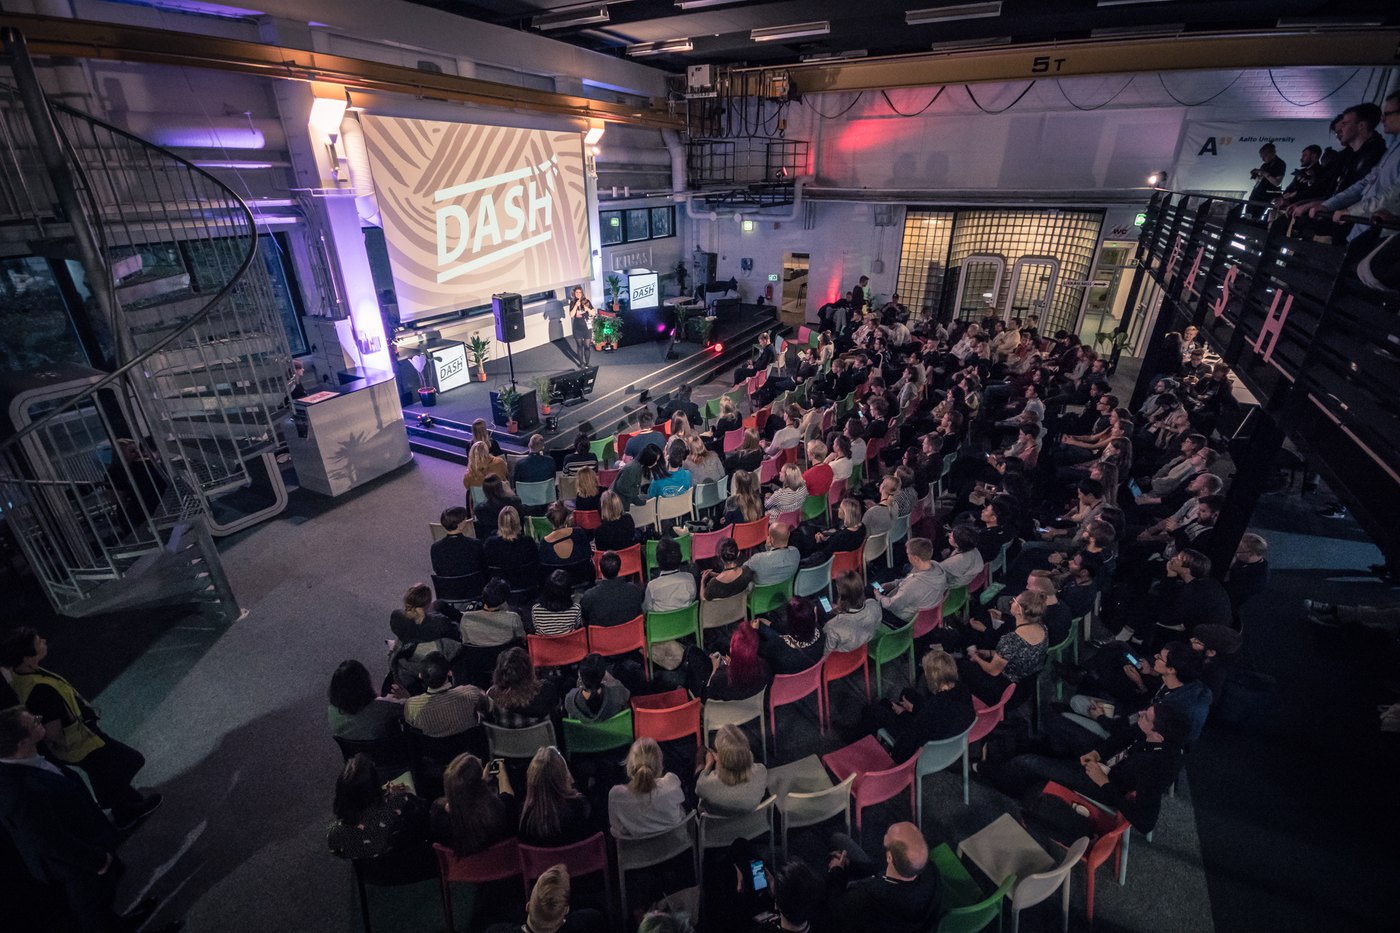
In 2017 I co-founded Dash, a multidisciplinary design hackathon at Aalto University. My co-lead Axel Cedercreutz and I gathered a team of ten and sold the idea to sponsors and the community: eight months later Dash ran with a 40k€ budget, partners such as Fazer and EA Games, around 40 volunteers and 200 participants. New teams have made it annual since. Selling a function that does not exist yet, to people who have not asked for it, is a skill I have used in every job since.

The Dash main hall during a talk: a speaker on a low stage in front of a large projected Dash logo, with a full house of several hundred people seated in rows of coloured chairs, more watching from a balcony, and an Aalto University banner on the back wall
Photograph: Atte Mäkinen.

Thoughts or questions?

I'm glad you read my portfolio, and would be excited to continue the conversation. Don't hesitate to reach out!

iida.palosuo@gmail.com